2016 April New: Microsoft 70-466 Exam Questions and Answers Updated!
QUESTION 1
You are designing a SQL Server Reporting Services (SSRS) report to display product names and their year-to-date (YTD) sales quantity YTD sales quantity values are classified in three bands: High Sales, Medium Sales, and Low Sales.
You add a table to the report.
Then you define two columns based on the fields named ProductName and YTDSalesQuantity.
You need to set the color of the product text to red, yellow, or blue, depending on the value of the YTD sales quantity values.
What should you do?
A. Use an expression for the TextDecoration property of the text box.
B. Use an expression for the Style property of the text box.
C. Add an indicator to the table.
D. Use an expression for the Font property of the text box.
E. Use an expression for the Color property of the text box.
Answer: E
QUESTION 2
You are developing a SQL Server Reporting Services (SSRS) report that renders in HTML.
The report includes a dataset with fields named Description, Price, and Color.
The report layout includes a table that displays product details and also includes columns named Description, Price, and Color.
You need to modify the report so that users can sort products by the Price column.
What should you do?
A. Add a custom action to the Price text box.
B. Set the SortExpression property to =Fields!Price.Value for the Price text box.
C. In the Expression dialog box for the Price text box, enter the =SortBy FieldslPrice.Value
expression.
D. Set the SortExpression value to =Fields!Price.Description for the Price text box.
Answer: B
QUESTION 3
You are working with a SQL Server Reporting Services (SSRS) instance in native mode.
An item role named Reports Writer is present on the server.
The Reports Writer role cannot view and modify report caching parameters.
You need to ensure that the Reports Writer role can view and modify report caching parameters. What should you do?
A. Add the Manage individual subscriptions task to the Reports Writer role.
B. Add the Manage report history task to the Reports Writer role.
C. Add the View data sources task to the Reports Writer role.
D. Add the Manage all subscriptions task to the Reports Writer role.
Answer: B
QUESTION 4
Drag and Drop Questions
You are developing a SQL Server Analysis Services (S5AS) cube.
The cube consists of a single measure group.
The measure group consists of one partition that uses MOLAP.
The proactive caching policy has the following requirements:
– The cache must be updated when data is changed in the table named tbIOrders.
– Changes must be notified through the use of the XML for Analysis (XMLA) NotifyTableChange command.
You need to configure the proactive caching policy to meet the requirements.
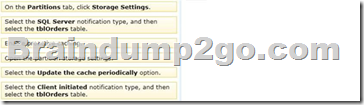
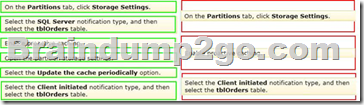
Which three actions should you perform in sequence? (To answer, move the appropriate actions from the list of actions to the answer area and arrange them in the correct order.)
Answer:
Explanation:
Box 1: On the Partitions tab, Click Storage Settings We specify the Storage Settings for the correct partition.
Box 2: Enable proactive caching.
We enable proactive caching.
Box 3: Select the Client initiated notification type, and then select the tblOrders table.
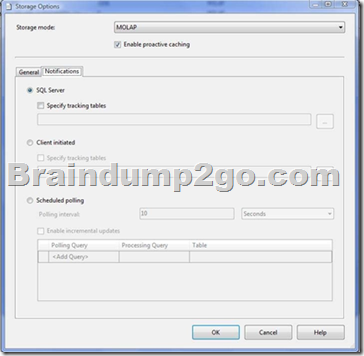
On the Notifications tab, there are three options out of which, as shown below, you can select any one at a time.
– SQL Server-With this option, SSAS uses SQL Server notification services/specialized trace mechanism to identify data changes.
– Client initiated-With this option, client can specify the XMLA (XML for Analysis) command (NotifyTableChange) to identify data changes.
– Scheduled polling-With this option, SSAS uses a series of queries to see (polling at defined interval) if there is any data change at the underlying relational database.
Note:
You use the Storage Settings dialog box in BIDS (Business Intelligence Development Studio) to set the proactive caching feature, storage location, and notification settings for a dimension, cube, measure group, or measure group partition.
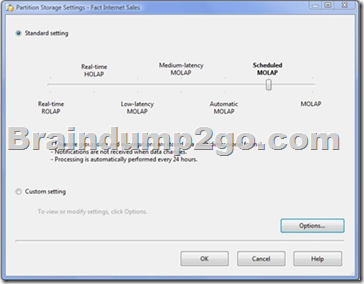
The Custom Setting allows you to explicitly enable proactive caching (if you don’t want to use Standard Setting), set storage mode, and notification options. (Box 2)
QUESTION 5
You manage a SQL Server Reporting Services (SSRS) instance.
The ReportingServicesService.exe.config file has been modified to enable logging.
Some users report that they cannot access the server.
You need to ascertain the IP addresses of the client computers that are accessing the server. What should you do?
A. View the Report Server service trace log.
B. View the ExecutionLog view in the Report Server database.
C. View the Report Server HTTP log.
D. View the Windows System event log.
Answer: C
QUESTION 6
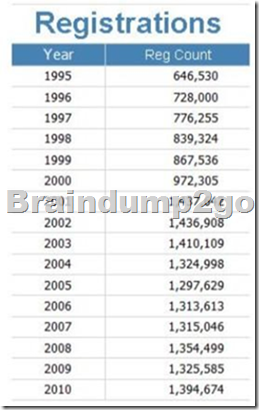
You are developing a SQL Server Reporting Services (SSRS) report.
The report includes a dataset with fields named Year, MonthNumber, and RegCount.
The report includes a table that displays the number of recorded registration occurrences per year, as shown in the following diagram.
You need to modify the table to include a graphical item displaying the monthly registration trend to the right of the Reg Count column.
What should you do?
A. Add an Indicator item to a new column on the right of the Reg Count column. Select the
Directional Indicator Type and then assign the MonthNumber field to the Start property.
B. Add a text box to a new column on the right of the Reg Count column.
Then use a Go to report action to link to a separate report showing the monthly trend.
C. Add a Sparkline item to a new column on the right of the Reg Count column.
Then select the RegCount field for Values and the MonthNumber field for Series Groups.
D. Add a Sparkline item to a new column on the right of the Reg Count column.
Then select the RegCount field for Values and the MonthNumber field for Category Groups.
E. Add an Indicator item to a new column on the right of the Reg Count column.
Select the Directional Indicator Type and then select the MonthNumber field for Value.
Answer: D
QUESTION 7
You are designing a SQL Server Reporting Services (SSRS) report that sources data from a SQL Azure database.
The report must display the value and status of a Key Performance Indicator (KPI).
Which report item should you use? (Each answer presents a complete solution. Choose all that apply.)
A. Sparkline
B. Gauge
C. Indicator
D. Data Bar
E. Image
Answer: BC
Explanation:
B: The Gauge data region is a one-dimensional data region that displays a single value in your dataset. An individual gauge is always positioned inside a gauge panel, where you can add child or adjacent gauges.
You can use gauges to perform many tasks in a report:
Display key performance indicators (KPIs) in a single radial or linear gauge.
Place a gauge inside a table or matrix to illustrate values inside each cell.
Use multiple gauges in a single gauge panel to compare data between fields.
C: Indicators are minimal gauges that convey the state of a single data value at a glance.
The icons that represent indicators and their states are simple and visually effective even when used in small sizes.
You can use state indicators in your reports to show the following:
Trends by using trending-up, flat (no change), or trending-down arrows.
State by using commonly recognized symbols such as checkmarks and exclamation marks.
Conditions by using commonly recognized shapes such traffic lights and signs.
Ratings by using common recognized shapes and symbols that show progress such number of quadrants in a square and stars.
Incorrect:
Not A, not D:
Sparklines and data bars are small, simple charts that convey a lot of information in a little space, often inline with text. Sparklines and data bars are often used in tables and matrices. Their impact comes from viewing many of them together and being able to quickly compare them one above the other, rather than viewing them singly. They make it easy to see the outliers, the rows that are not performing like the others. Although they are small, each sparkline often represents multiple data points, often over time. Data bars can represent multiple data points, but typically illustrate only one.
QUESTION 8
You are developing a SQL Server Analysis Services (SSAS) multidimensional project.
A fact table is related to a dimension table named DimScenario by a column named ScenarioKey.
The dimension table contains three rows for the following scenarios:
– Actual
– Budget Q1
– Budget Q3
You need to create a dimension to allow users to view and compare data by scenario.
What should you do?
A. Use role playing dimensions.
B. Use the Business Intelligence Wizard to define dimension intelligence.
C. Add a measure that uses the Count aggregate function to an existing measure group.
D. Add a measure that uses the DistinctCount aggregate function to an existing measure group.
E. Add a measure that uses the LastNonEmpty aggregate function.
Use a regular relationship between the time dimension and the measure group.
F. Add a measure group that has one measure that uses the DistinctCount aggregate function.
G. Add a calculated measure based on an expression that counts members filtered by the
Exists and NonEmpty functions.
H. Add a hidden measure that uses the Sum aggregate function.
Add a calculated measure aggregating the measure along the time dimension.
I. Create several dimensions.
Add each dimension to the cube.
J. Create a dimension.
Then add a cube dimension and link it several times to the measure group.
K. Create a dimension.
Create regular relationships between the cube dimension and the measure group.
Configure the relationships to use different dimension attributes.
L. Create a dimension with one attribute hierarchy.
Set the IsAggregatable property to False and then set the DefaultMember property.
Use a regular relationship between the dimension and measure group.
M. Create a dimension with one attribute hierarchy.
Set the IsAggregatable property to False and then set the DefaultMember property.
Use a many-to-many relationship to link the dimension to the measure group.
N. Create a dimension with one attribute hierarchy.
Set the ValueColumn property, set the IsAggregatable property to False, and then set the
DefaultMember property.
Configure the cube dimension so that it does not have a relationship with the measure group.
Add a calculated measure that uses the MemberValue attribute property.
O. Create a new named calculation in the data source view to calculate a rolling sum.
Add a measure that uses the Max aggregate function based on the named calculation.
Answer: L
QUESTION 9
You are designing a SQL Server Analysis Services (SSAS) cube.
You need to create a measure to count unique customers.
What should you do?
A. Use role playing dimensions.
B. Use the Business Intelligence Wizard to define dimension intelligence.
C. Add a measure that uses the Count aggregate function to an existing measure group.
D. Add a measure that uses the DistinctCount aggregate function to an existing measure group.
E. Add a measure that uses the LastNonEmpty aggregate function.
Use a regular relationship between the time dimension and the measure group.
F. Add a measure group that has one measure that uses the DistinctCount aggregate function.
G. Add a calculated measure based on an expression that counts members filtered by the Exists
and NonEmpty functions.
H. Add a hidden measure that uses the Sum aggregate function.
Add a calculated measure aggregating the measure along the time dimension.
I. Create several dimensions.
Add each dimension to the cube.
J. Create a dimension.
Then add a cube dimension and link it several times to the measure group.
K. Create a dimension.
Create regular relationships between the cube dimension and the measure group.
Configure the relationships to use different dimension attributes.
L. Create a dimension with one attribute hierarchy.
Set the IsAggregatable prooerty to False and then set the DefaultMember property.
Use a regular relationship between the dimension and measure group.
M. Create a dimension with one attribute hierarchy.
Set the IsAggregatable property to False and then set the DefaultMember property.
Use a many-to-many relationship to link the dimension to the measure group.
N. Create a dimension with one attribute hierarchy.
Set the ValueColumn property, set the IsAggregatable property to False, and then set the
DefaultMember property.
Configure the cube dimension so that it does not have a relationship with the measure group.
Add a calculated measure that uses the MemberValue attribute property.
O. Create a new named calculation in the data source view to calculate a rolling sum.
Add a measure that uses the Max aggregate function based on the named calculation.
Answer: F
QUESTION 10
You are developing a SQL Server Analysis Services (SSAS) cube.
The data warehouse has a table named FactStock that is used to track movements of stock.
A column named MovementQuantity contains quantities of stock.
A positive quantity is used for input and negative quantity is used for output.
A column named MovementDate is related to the time dimension.
The quantity in stock, at a given point in time, can be evaluated as the sum of all MovementQuantity values at that point in time.
You need to create a measure that calculates the quantity in stock value.
What should you do?
A. Use role playing dimensions.
B. Use the Business Intelligence Wizard to define dimension intelligence.
C. Add a measure that uses the Count aggregate function to an existing measure group.
D. Add a measure that uses the DistinctCount aggregate function to an existing measure group.
E. Add a measure that uses the LastNonEmpty aggregate function.
Use a regular relationship between the time dimension and the measure group.
F. Add a measure group that has one measure that uses the DistinctCount aggregate function.
G. Add a calculated measure based on an expression that counts members filtered by the Exists
and NonEmpty functions.
H. Add a hidden measure that uses the Sum aggregate function.
Add a calculated measure aggregating the measure along the time dimension.
I. Create several dimensions.
Add each dimension to the cube.
J. Create a dimension.
Then add a cube dimension and link it several times to the measure group.
K. Create a dimension.
Create regular relationships between the cube dimension and the measure group.
Configure the relationships to use different dimension attributes.
L. Create a dimension with one attribute hierarchy.
Set the IsAggregatable property to False and then set the DefaultMember property.
Use a regular relationship between the dimension and measure group.
M. Create a dimension with one attribute hierarchy.
Set the IsAggregatable property to False and then set the DefaultMember property.
Use a many-to-many relationship to link the dimension to the measure group.
N. Create a dimension with one attribute hierarchy.
Set the ValueColumn property, set the IsAggregatable property to False, and then set the
DefaultMember property.
Configure the cube dimension so that it does not have a relationship with the measure group.
Add a calculated measure that uses the MemberValue attribute property.
O. Create a new named calculation in the data source view to calculate a rolling sum.
Add a measure that uses the Max aggregate function based on the named calculation.
Answer: H
2016 New Microsoft 70-466 Exam Study Materials:
1.2016 Latest Microsoft 70-466 Exam PDF and VCE Dumps 186Q&As – All New Questions Included:http://www.braindump2go.com/70-466.html [100& Pass 70-466 Exam Guaranteed!]
2.2016 New Microsoft 70-466 Exam Questions and Answers PDF – Google Drive:https://drive.google.com/folderview?id=0B9YP8B9sF_gNUjVNQ2xGZFFiRTA&usp=sharing